Earth in Space & Time
The origin story written in starlight — the universe, our solar system, and how astronomers read distance, age, and motion from the sky. Deep time, and Earth's place in it.
From the planet's molten interior to the edge of the observable universe — scholars learn to read Earth as a system, and the sky as a record of deep time.
Scholars and families — open these first. Everything further down this page (the field map, the 3D stories, the labs) sits underneath them.
New to it? Read what the Assessment Center is, who built it, and how scholar data is protected.
Earth Systems Science is the studio's newest course — a senior-year capstone where the habits built in mathematics turn outward to the natural world. The same standards apply here as everywhere in the studio: reason from evidence, model real systems, and build understanding that lasts longer than a test.
Four great domains thread through the six modules — the thematic map behind the sequence above.
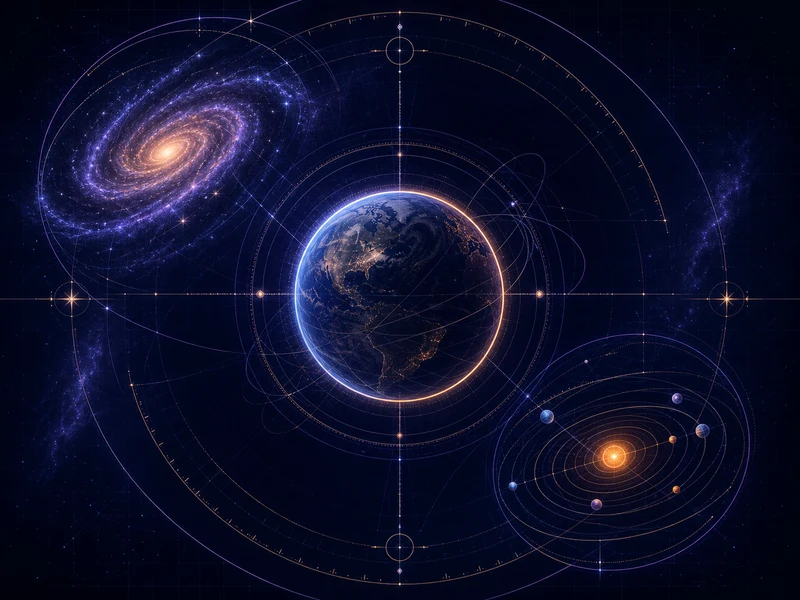
The origin story written in starlight — the universe, our solar system, and how astronomers read distance, age, and motion from the sky. Deep time, and Earth's place in it.
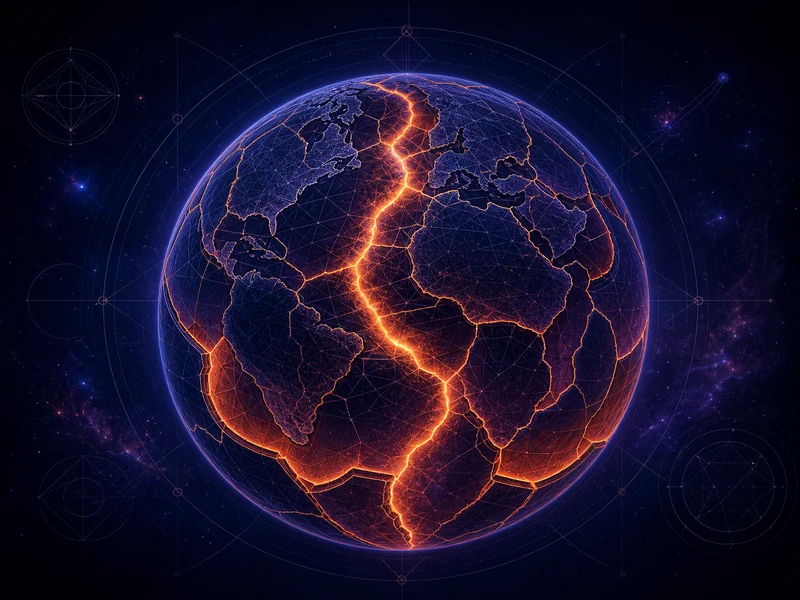
Plate tectonics as the planet's grand unifying theory — earthquakes, volcanoes, the rock record, and the slow machinery that builds mountains and opens oceans.
Oceans and atmosphere as one coupled engine — currents, weather systems, and the energy budget that drives climate across seasons, centuries, and ice ages.
Resources, natural hazards, and the evidence-based reasoning scholars need as citizens of a planet — reading data honestly and weighing real trade-offs.
Every module starts with an everyday question, moves through a manipulable 3D story, and ends with evidence scholars can explain in their own words.
Why do the granite counter and the dark road outside look so different if both began as melted rock?
Matter, minerals, rock identification, Earth's layers, and energy-driven change establish the system-thinking used all year.
Why can one hard rain flood a street while the grassy yard beside it absorbs the same storm?
Weathering, erosion, deposition, groundwater, and watersheds show how water continuously reshapes land and human choices.
Why can warm Gulf water turn an ordinary cluster of storms into a dangerous hurricane?
Radiation, atmospheric circulation, ocean currents, severe weather, and climate become one coupled flow of energy and matter.
How can a phone warn people that shaking is coming when an earthquake has already started?
Earth's interior, heat flow, plate motion, earthquakes, volcanoes, and mountain building connect hidden processes to visible hazards.
When you pass a road cut, how can tilted layers reveal events that happened millions of years apart?
Relative and absolute dating turn the rock record into a timeline, then connect deep time to resources and present-day trade-offs.
Why does your shadow change through the day and through the year even though the Sun seems to follow the same sky?
Solar-system formation, Sun-Earth-Moon geometry, seasons, tides, and a clearly labeled astronomy-enrichment finale widen the system.
Standards note: Module 6 begins with Earth Systems Science expectations about solar-system formation, objects that affect Earth, and Moon origins. Stellar and galactic exploration is clearly treated as capstone enrichment rather than mislabeled as core Earth Systems Science.
The cycle repeats on purpose: notice a real phenomenon, manipulate a model, explain the evidence, apply the idea, then revise the claim.
Begin with a driveway flood, storm, road cut, phone alert, rock surface, or changing shadow.
Orbit the scene, move one meaningful control, and watch the system respond.
Name each component, read the measurement, and connect cause to observed effect.
Use the science to make a forecast, evaluate a hazard, or defend a practical choice.
State what the model leaves out, compare the claim with evidence, and improve the explanation.
Choose a module, orbit the model, move its control, and read every labeled part. Each story includes a simple explanation, a deeper scientific explanation, and an honest model boundary.
The full periodic table — all 118 elements — read the way an Earth scientist reads it. Eight elements build about 98.5% of the crust; filter to those eight and the pattern behind every rock-forming mineral becomes visible.
Search by name, symbol, or atomic number; filter by category or by crustal abundance; then open any element for its mass, group, period, block, electron configuration, and state at standard conditions. Move through the table with the arrow keys.
Want one on paper? Open the printable STEM Studio periodic table — a single landscape page, designed to stay readable in black and white.
Why this matters here: oxygen and silicon alone are roughly three quarters of the crust by mass, which is why silicate minerals dominate the rock record you identify in Module 1 and the weathering products you trace in Module 2.
Everything below is built here in the studio, free, and reachable without an outside account. Several of these pages existed but were never linked from this course — they are linked now.
Use them between class days: practice, take notes, print what you need, and get unstuck.
Unlimited self-checking practice, generated fresh each time, across all six Earth Systems Science modules at five difficulty levels. Sign in with your scholar alias and your progress is saved.
Enter the Practice Gym →Every lab in the course, by module and topic — the six precision labs and eighteen station labs, each with its opening phenomenon, the performance expectations it serves, and how long it runs. The fastest way to find one lab again.
Browse the labs →The six anchor projects with their driving questions, calendar windows, deliverables, and the field journal that carries evidence from one module to the next.
Open the project library →Fifteen note templates — including a lab notebook and Cornell — with real rendered equations and clean printouts. Good for turning a 3D story into evidence you can study from.
Open Note Studio →Generate and print graph paper, data tables, note templates, flashcards, and visual learning tools — useful when the screen-light route is the right route.
Open Resource Studio →The interactive table above, as a single landscape page designed to stay readable in black and white. Paper copy for the lab bench or the binder.
Open the print sheet →How to get help from a person, plus the 24/7 self-help toolkit — foundations review, Note Studio, and practice, in the order to try them.
Get support →Every module has a prerequisite review that rebuilds the ideas it assumes. Start there when a module feels like it began three steps ahead of you.
Start with Module 1 foundations →At-home work extends a concept already taught. It never assumes special supplies, fast internet, or that every scholar has the same home conditions.
Track a shadow, sketch runoff, photograph a rock or cloud when safe, or annotate a teacher-provided image. No purchase required.
Return to the everyday 3D story, change one variable, capture the before-and-after evidence, and explain the pattern.
Use a diagram, short paragraph, audio explanation, or data table to show what changed, why it changed, and where uncertainty remains.
What counts as understanding: not memorizing a label. Scholars should be able to point to evidence, describe the mechanism in simple language, use the deeper scientific language when ready, and identify one limit of the model.
Three doors into the course. Start with the syllabus.
The course is built. Start with the six Concepts in Action stories above, then enter any module for its precision lab, station labs, foundations support, and teaching notes.